While noone purchased the NXT just to print words and numbers on the screen, knowing how to print things on the NXT screen can be useful. In this post, I’ll use the NXT sound sensor to illustrate how to use the NXC printing commands with the signal detected by NXT sensors.
NXT sound sensor detects the intensity of sound in the surrounding area; louder sound – higher the intensity.
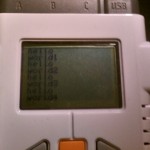
Our first goal is to set up the sound sensor and print out the detected signal on the screen. To do so, we’ll use the following code
task main()
{
   SetSensorSound(S1);
   int hlp = 0;
   while (true)
   {
     NumOut(0, 0, SensorScaled(S1));
     Wait(100);
    }
}
The “SetSensorSound” command assigns the sound sensor to port 1, command “SensorScaled(S1)” reads the signal detected by this sensor, and the command “NumOut” prints the detected signal on the screen, at the location (0,0).
Now, let’s say that we not only want to see the current value (strength) of detected signal, but also to see the values of signal detected in previous one, two, three,… seconds ago. Printing the detected values on the screen adjacent to each other may not be too informative. A better approach would be to print the detected signal in the 2-dimensional coordinate system, where x-axis represents time and y-axis represents the signal value (strength). We can plot the coordinate system as follows:
task main()
{
   ClearScreen();
   RectOut(0, 0, 99, 63);
   TextOut(90, 6, ">");
   TextOut(23, 45, "^");
   LineOut(25, 10, 90, 10);
   LineOut(25, 10, 25, 50);
   NumOut(12, 8, 0);
   NumOut(8, 25, 50);
   NumOut(2, 45, 100);
   Wait(1000);
}
With the “RectOut” command we plot a rectangular box in which we’ll draw our coordinate system. Then, we use the “LineOut” commands to plot x- and y-axes. The (0, 0) point of the coordinate system is in the (25, 10) point of the screen. We use text printing command “TextOut” to plot the arrow of the coordinate system, and “NumOut” command to plot the percentage values that will be used to describe the signal strength.
Now, we need to combine these two codes together.
#define x0 25
#define y0 10
#define numElements 65
#define perSignal 50
#define maxSignal 100

//procedure that plots coordinate system
void drawAxes()
{
   ClearScreen();

   RectOut(0,0, 99, 63);

   TextOut(90, 6, ">");
   TextOut(23, 45, "^");

   LineOut(x0, y0, x0 + numElements, y0);
   LineOut(x0, y0, x0, perSignal);

   NumOut(12, 8, 0);
   NumOut(8, 25, 50);
   NumOut(2, 45, 100);
}

//procedure that plots n(umElements) signal values onto the coordinate system
void plotDBs(int arrayDB[], int indexDB)
{
   drawAxes();

   //first n(umElements)
   if (indexDB < numElements)
     for (int i = 0; i < numElements; i++)
	LineOut(x0 + i, y0, x0 + i, y0 + arrayDB[i]);
  // all other elements
   else
   {
     int j = 0;

     for (int i = (indexDB % numElements + 1); i < numElements; i++)
	LineOut(x0 + j, y0, x0 + j++, y0 + arrayDB[i]);
      for (int i = 0; i < indexDB % numElements + 1; i++)
	LineOut(x0 + j, y0, x0 + j++, y0 + arrayDB[i]);
   }
}

task main()
{
   //array that keeps track of the last  n(umElements) values detected by the sensor
   int myVector[numElements]; //the array will be automatically initialized to zero

   SetSensorSound(S1);

   int hlp = 0;

   while (true)
   {
     int signalIn = SensorScaled(S1);

     //we will scale the imput values so they plot within the coordinate system
     if (signalIn > maxSignal)
         signalIn = maxSignal;

     myVector[hlp % numElements] =  (perSignal - y0)*signalIn/maxSignal;

     plotDBs(myVector, hlp);

     hlp++;

     Wait(100);
    }
}
And here is how it looks
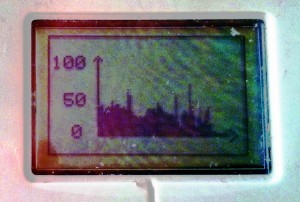
Sound sensor output
The program consists of three procedures: 1) drawAxes that creates the coordinate system, 2) plotDBs that plots the last n sensor values onto the coordinate system, and 3) the main task that sets up the sensor, reads (and stores) the sensor signal, and plots it onto the coordinate system. The program keeps track and plots up to 65 sensor signal values, i.e., 65 latest time points. We assumed that the maximum value the sensor can detect is 100. The signal values are scaled 50% for the plotting/fitting purposes.